A profitable route in Transport Fever 3 starts with real demand, a complete connection, restrained construction, and vehicles that spend as little time empty as possible. After the line begins operating, verify the result in its Balance chart: the line was profitable in a given year when its blue income bar is higher than its red running-cost bar.
Compare cargo, vehicles, and route layouts against the network they will serve. Demand, terrain, empty running, capacity, and loading conditions can differ between otherwise similar lines, so another route’s success does not establish the result for this one. Build the smallest service that can complete the job, then use the line and vehicle statistics to identify what needs changing.
Confirm That the Route Can Generate Revenue
Do not start with the vehicle you want to use. Start with the trip that passengers or cargo actually need to make.
For a cargo route, confirm that the destination requires the cargo type you intend to deliver. The connection also needs suitable cargo stations and a complete path between the source and destination. For a passenger route, a direct connection between neighboring towns is a practical starting point, but stations have limited catchment areas. A station outside the useful parts of a town may leave the line with too few passengers even when the two towns appear well connected on the map.
Compare Route Candidates Before Construction
Use the same criteria for every candidate instead of choosing the line that looks busiest or longest. The purpose of this comparison is to avoid committing to an expensive connection before its basic operating case is sound.
| Route factor | What to inspect | Better starting condition | Warning sign |
|---|---|---|---|
| Demand | Required cargo or reachable passengers | A visible source and valid destination | No confirmed receiver for the planned load |
| Station coverage | Station type and catchment area | Relevant buildings or districts are covered | The station sits near a town but misses useful coverage |
| Construction | Terrain, trees, roads, and tracks | A direct alignment that follows level ground or contours | Extensive terrain modification or a steep approach |
| Loaded running | Outbound and return opportunities | Useful loads for most of the journey | A guaranteed empty return over the whole line |
| Capacity | Expected load compared with vehicle capacity | A modest initial service that can be adjusted | Large capacity purchased before demand is demonstrated |
| Loading | Vehicle and terminal specialization | Suitable equipment for the cargo being moved | Slow terminal work that keeps vehicles waiting |
| Verification | Available line and vehicle statistics | A line whose performance can be isolated | A complex network where several changes happen at once |
This table is a screening tool, not a profit formula. It does not assign invented scores or assume that one factor can compensate for every other weakness.
Keep Construction Proportional to the First Service
Terrain modification is expensive, and steep hills can slow vehicles. Use the contour-lines overlay to find a practical alignment, follow level ground where possible, and consider routes along rivers when the terrain supports them. Removing trees and heavily reshaping terrain can also harm your reputation in nearby towns.
The goal is not to force the shortest geometric line across every obstacle. Compare the benefit of a straighter route with the construction required to create it. A gentle alignment that uses the existing landscape can be a better first investment than a direct route requiring extensive cuts, fills, or demolition.
Build only the infrastructure needed for the first working service. A simple cargo chain or direct passenger connection is easier to evaluate than a large network opened all at once. Complex networks often require substantial upfront investment, but an early loss does not prove that expansion will eventually pay for itself. Let operating evidence justify the next addition.
Newly purchased vehicles need to be assigned to a line before they can operate the intended service. Review the stop order, assign a compatible vehicle, and observe loading, travel, delivery, and the return movement. If nothing is transported, repair that connection before interpreting the line as a financial failure. Once movement works, the line details provide capacity, current load, rate, frequency, transported volume, and Balance for comparison.
Minimize Empty Running
Empty vehicles earn no revenue, so the share of a route spent empty is one of the clearest places to look for improvement. The strongest case is a vehicle that can carry a useful load in both directions. Freight wagons, trucks, and cargo ships can be refitted automatically at stations, making some return-load arrangements possible without dedicating a second vehicle type to the reverse trip.
A return load is an opportunity, not a requirement to invent a need that does not exist. Confirm that the reverse cargo has its own source and destination. If it does not, use the one-way demand as the real basis for sizing the line.
When a full return load is unavailable, reduce the financial exposure of the empty leg:
- Start with fewer vehicles rather than buying for unproven future volume.
- Avoid capacity that regularly travels unused.
- Prefer a clear direct movement over a complicated detour added only to make the route look busier.
- Recheck whether another compatible cargo can use part of the return journey.
- Compare the line Balance before and after a change instead of assuming that added stops improve profit.
A vehicle that is full in one direction can still belong to a losing line if the return trip, waiting time, and running costs outweigh the income shown in the line statistics.
Match Vehicle Cost and Capacity to the Route
Vehicle selection should fit the work already identified. The vehicle store shows purchase cost, maintenance cost, availability, cargo specialization, loading speed, and technical properties. Use those fields to compare suitable options, but do not treat the most expensive or fastest vehicle as automatically best.
For trains, buy enough wagons to make the consist useful; an underbuilt train is likely to lose money. At the same time, do not add wagons merely because the locomotive can pull them. Compare the train's actual load and capacity after operation begins. The locomotive and wagons should also have similar top speeds for cost-effective operation, because mismatched equipment can leave paid capability unused.
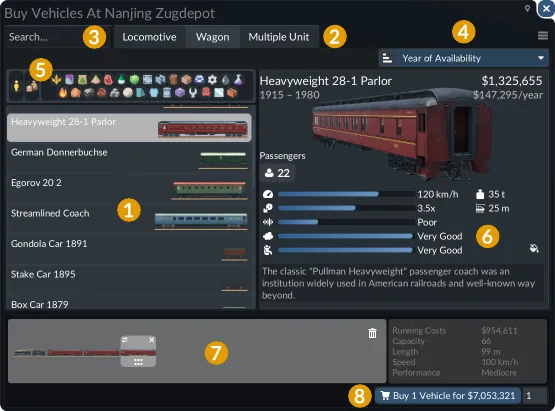
Compare the selected vehicle’s cost and capacity with route demand; the lower panel also shows the assembled consist and its running costs.
Use these operating signals when adjusting capacity:
- If vehicles are consistently full and cargo or passengers remain available, additional capacity or frequency may be justified.
- If vehicles repeatedly carry only a small share of their capacity, reduce the service before expanding infrastructure.
- If several vehicles bunch together or wait to load, investigate the operating flow rather than immediately buying more vehicles.
- If a train has too little wagon capacity, improve the consist before assuming that another locomotive is required.
- If a route uses specialized cargo consistently, suitable vehicles and terminals can reduce loading time.
Rate and frequency describe the service being delivered; current load and total capacity show how much of that service is being used. Read those values together. A frequent service with mostly empty vehicles can cost more without solving a demand problem.
Measure Profit in the Line Balance
The line details window provides the evidence needed to decide whether a route is profitable. Its basics section shows total capacity, currently loaded cargo, rate, and frequency. The Transported section shows the absolute number of items or passengers moved during the last year and can expand into a longer graph. The Balance section compares running costs with income over an extended period and provides a value for the last year.
Use the chart directly: when the blue income bar is higher than the red running-cost bar for a given year, the line was profitable in that year. When the red bar is higher, the route lost money during that year.
Do not judge a route from one visually full vehicle or one successful delivery. Read the last-year result alongside the extended chart, transported volume, rate, frequency, load, and capacity, using comparable operating periods when evaluating a change. Those fields reveal whether the financial result is persistent and whether the line is moving enough traffic to support its service level.
A positive line Balance proves that the line's income exceeded its running costs for the displayed period. It does not prove that every construction decision was efficient or that unlimited expansion will remain profitable. Treat expansion as a new decision requiring another review.
Separate a Bad Route from a Bad Vehicle Assignment
The vehicle details window includes its own Balance graph, along with current load, capacity, rate, frequency, condition, and the line to which the vehicle is assigned. Its blue and red bars use the same practical interpretation: blue above red for a given year indicates that the vehicle operated profitably in that year.
Compare the line and vehicle views to narrow down the problem:
| Observation | Likely issue to investigate | First response |
|---|---|---|
| Line loses money and most vehicles are lightly loaded | Service exceeds demonstrated demand | Reduce capacity or frequency, then review the charts again |
| Outbound vehicles load but the return trip is empty | Paid running time has no reverse load | Look for a valid compatible return movement or resize the line around one-way demand |
| Cargo or passengers are not transported | The connection is incomplete or demand is not being reached | Recheck station type, catchment, stops, destination, and line assignment |
| Line volume is healthy but loading creates delays | Terminal or vehicle loading may constrain flow | Consider suitable specialized vehicles and terminals |
| One vehicle performs poorly while others on the line do not | The assignment or vehicle-specific state differs | Compare that vehicle's load, capacity, condition, and Balance with the others |
| A train carries too little despite available demand | The consist may not provide useful wagon capacity | Review the number and type of wagons and their compatibility with the load |
| Vehicles slow heavily on part of the route | The alignment may impose a terrain penalty | Inspect steep sections before adding more vehicles |
These are diagnostic starting points, not guaranteed causes. Make one meaningful change at a time so the next chart remains interpretable.
Change one meaningful part of a losing service at a time, then compare the same line and vehicles again. Simultaneously replacing vehicles, moving stops, and rebuilding infrastructure makes it harder to understand which change affected the operating result.
Practical Profitable Route Patterns
These three patterns keep the initial service easy to observe and compare. Their operating results still need to be checked in Balance.
Direct Cargo Delivery
Connect a nearby source to a town that requires its cargo. Use cargo stations, verify their coverage, and begin with modest capacity. This pattern is simple to measure because its purpose is clear and its Balance can be reviewed independently.
Cargo Movement with a Return Load
Deliver raw materials in one direction and carry compatible finished goods on the return journey when valid sources and destinations make that possible. Automatic refitting for freight wagons, trucks, and cargo ships can support this arrangement. Do not add a reverse cargo solely to eliminate an empty graphic; it must have a real receiver.
Neighboring-Town Passenger Connection
Connect two neighboring towns with a direct passenger line. Because station catchment is limited, use multiple stops or a small local bus connection when residents across a town cannot reach the intercity station. Add service only when the displayed load and transported volume support it.
Each pattern still requires financial verification. A sensible layout is only a candidate until the line Balance shows that operating income exceeds running costs.
Revisit existing lines as towns grow and request more cargo or passenger transport. Compare new demand with actual loads and transported volume before increasing the service. A line sized for an earlier town can need adjustment later, but the next expansion still has to earn enough income to cover its operating costs.